Global Results
Climatescope’s primary goal is to present the public with an almanac of clean energy investment and deployment facts on 55 of the world’s most important developing nations, along with 25 Indian states and Chinese provinces. To that end, it takes into account four over-riding parameters, 54 data indicators, and 199 sub-indicators. In all, over 15,000 individual pieces of data were collected over a six-month period that included in-person visits to three quarters of the countries, states and provinces by the Bloomberg New Energy Finance team.
It is the authors’ hope this that this collection of potentially useful data be put to good use by investors, project developers, equipment makers, academics, policy-makers and others and that www.global-climatescope.org becomes an essential tool for conducting meaningful research.
These data also allow us to draw larger conclusions about activities in these nations and emerging markets more broadly, given that the Climatescope countries represent such a large percentage of non-OECD nations overall. Here, we examine some of the higher level trends we see in this year’s Climatescope.
A clear shift from north to south
2014 brought further proof that clean energy activity is shifting inexorably from “north” to “south”, from developed to developing countries. Along those lines, several important milestones were cleared in 2014.
New investment in renewable power generation in 2014 increased significantly in the 55 countries to hit a record annual high of $126bn – up $35.5bn, or 39%, from 2013 levels. For the first time, over half of all new annual investment into clean energy power generating projects globally went toward projects in emerging markets.
This significant flow of new capital is worth noting within the context of the UN-sponsored climate negotiations scheduled for December 2015 in Paris. Among other topics expected to be on the table at that critical conference: the potential for wealthier nations to invest more in lesser developed countries to help the latter mitigate and adapt to the effects of climate change.
The figure most commonly discussed on the international stage is $100bn to flow annually from north to south. The Climatescope data suggest that more total capital than that moved into clean energy projects alone in these countries in 2014. (Climatescope does not seek to quantify investment in other forms of sustainable infrastructure in emerging markets.)
It is notable that the majority of the $126bn invested in Climatescope countries did not emanate from OECD countries. Rather, it was south-south investment within the 55 nations that accounted for $79bn of the total, with the balance ($47bn) represented by north-south flows.
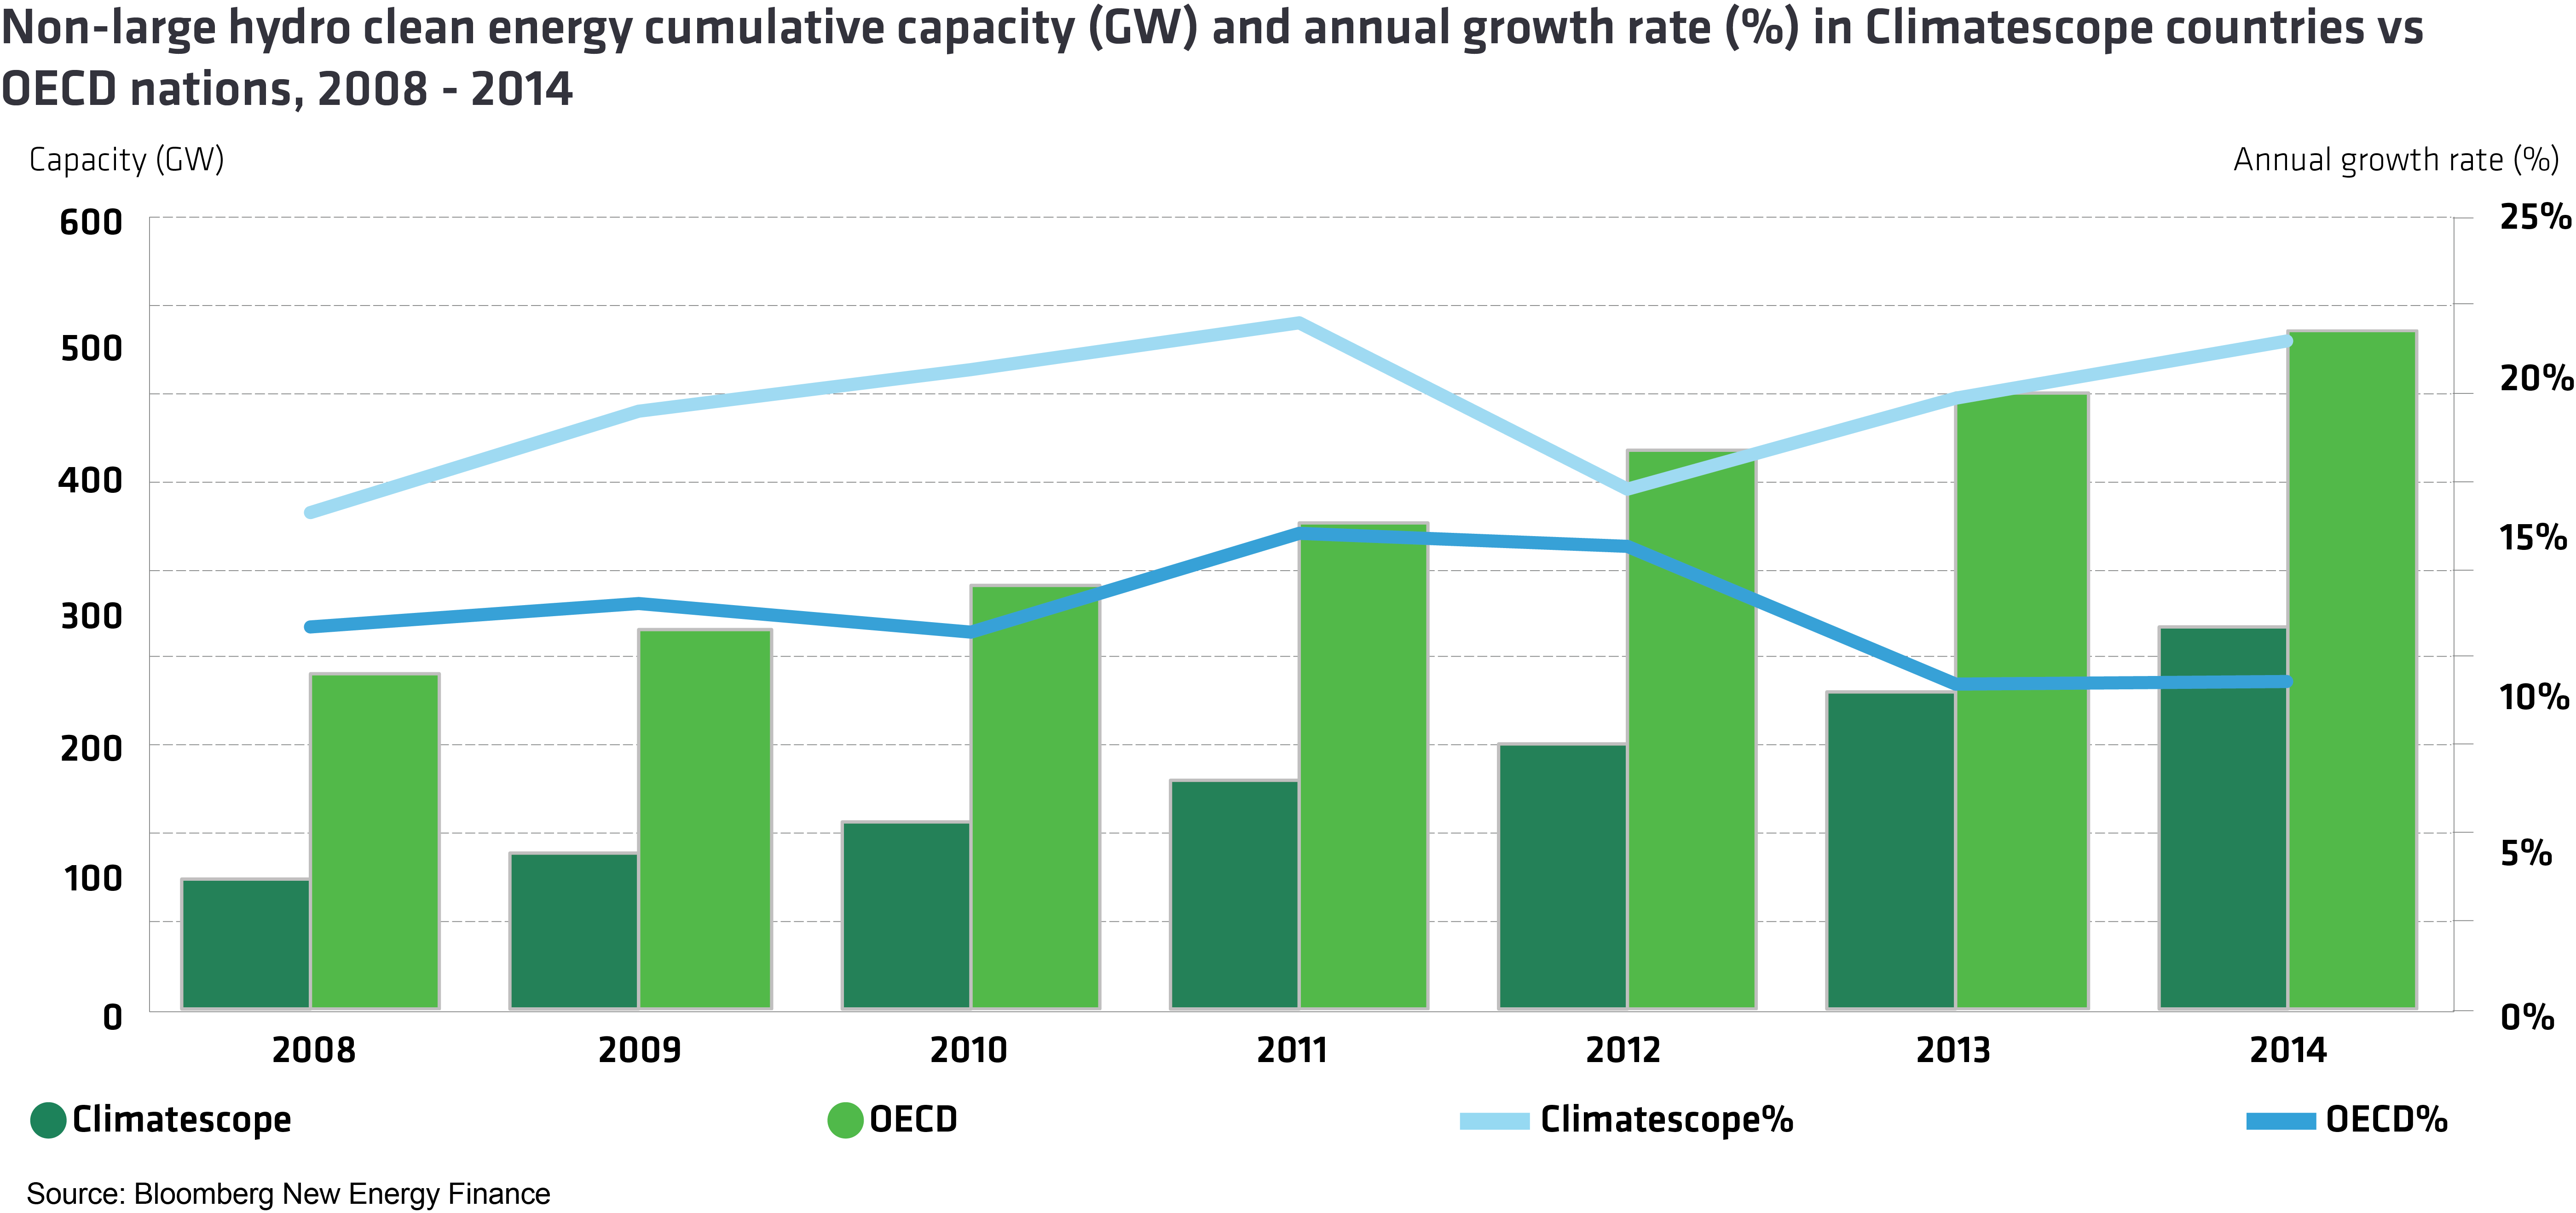
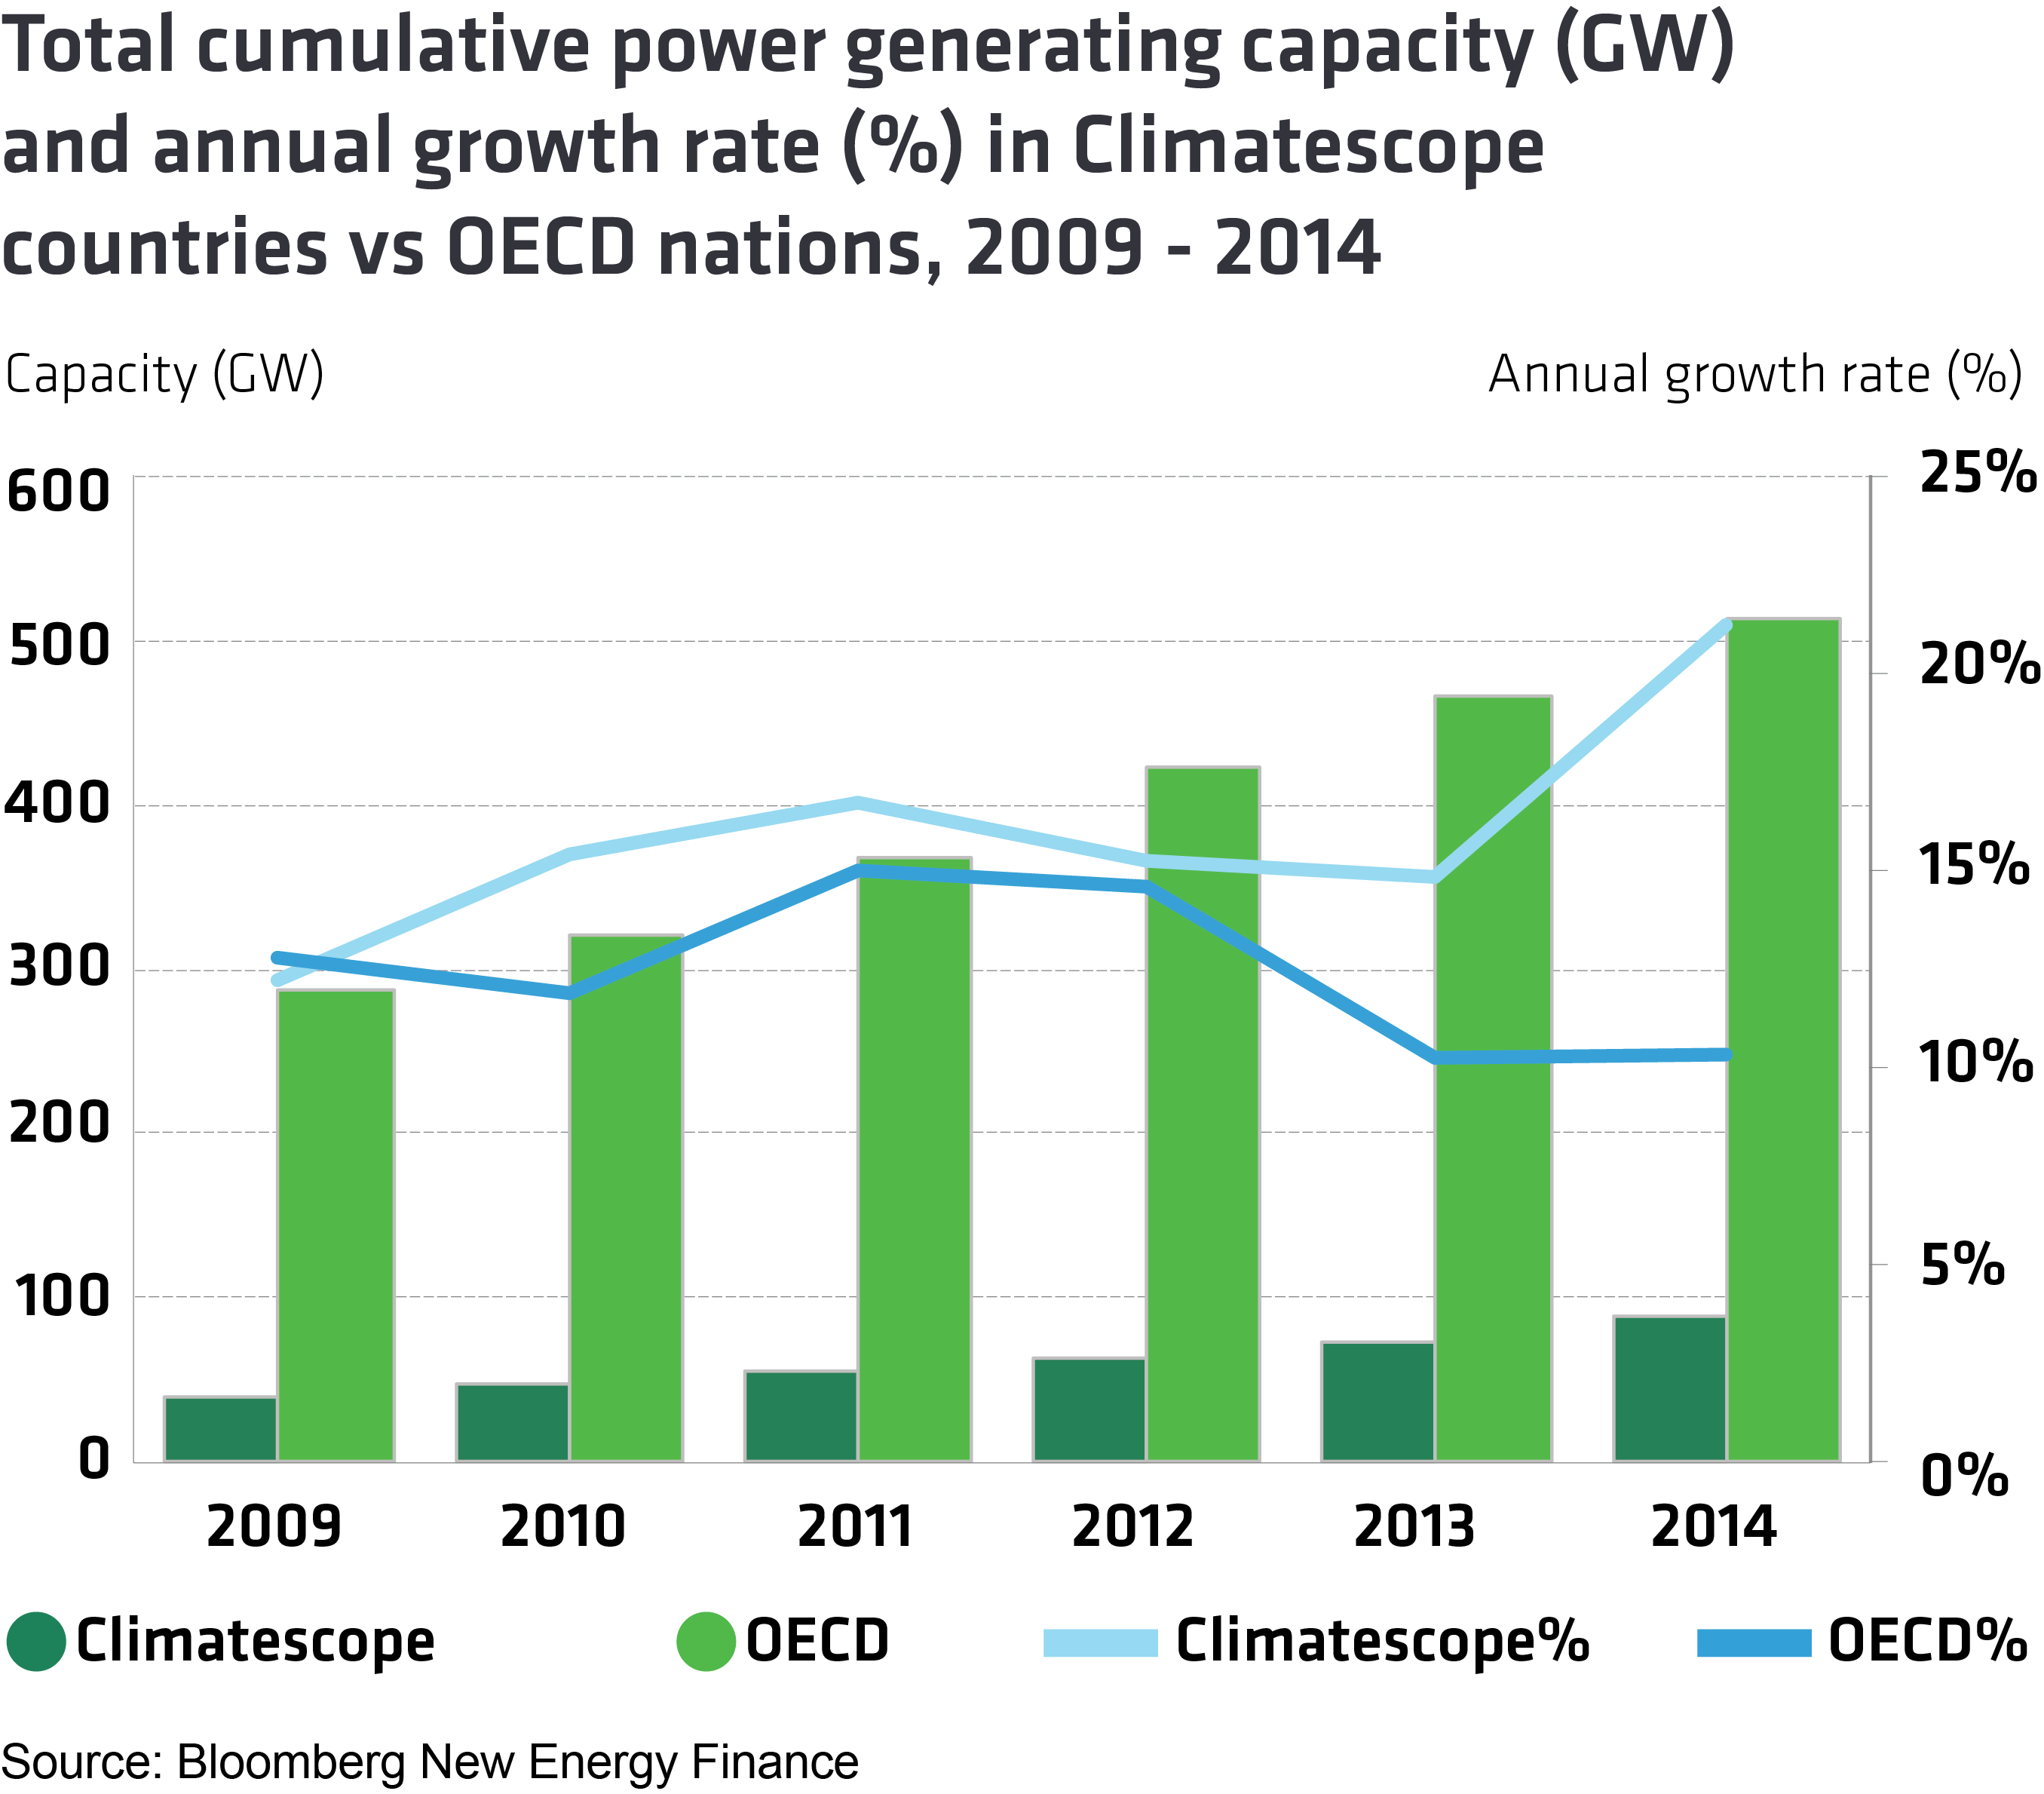
The shift toward emerging economies can also be seen in terms of where clean energy power generating capacity is being built. A total of 50.4 gigawatts (GW) of new clean capacity was commissioned in Climatescope countries, marking a 21% uptick from the prior year. For the first time, annual clean energy capacity deployed in emerging markets topped that in wealthier OECD nations. Moreover, on a percentage basis, clean energy capacity is growing twice as quickly in Climatescope nations compared to in the OECD.
Large hydro continues to play a vital role in supplying power in emerging and developing economies, particularly in Latin America and China. Climatescope does not include large hydro projects in its accounting for clean energy as the goal is to focus on technologies that can be deployed more rapidly and have near immediate impact.
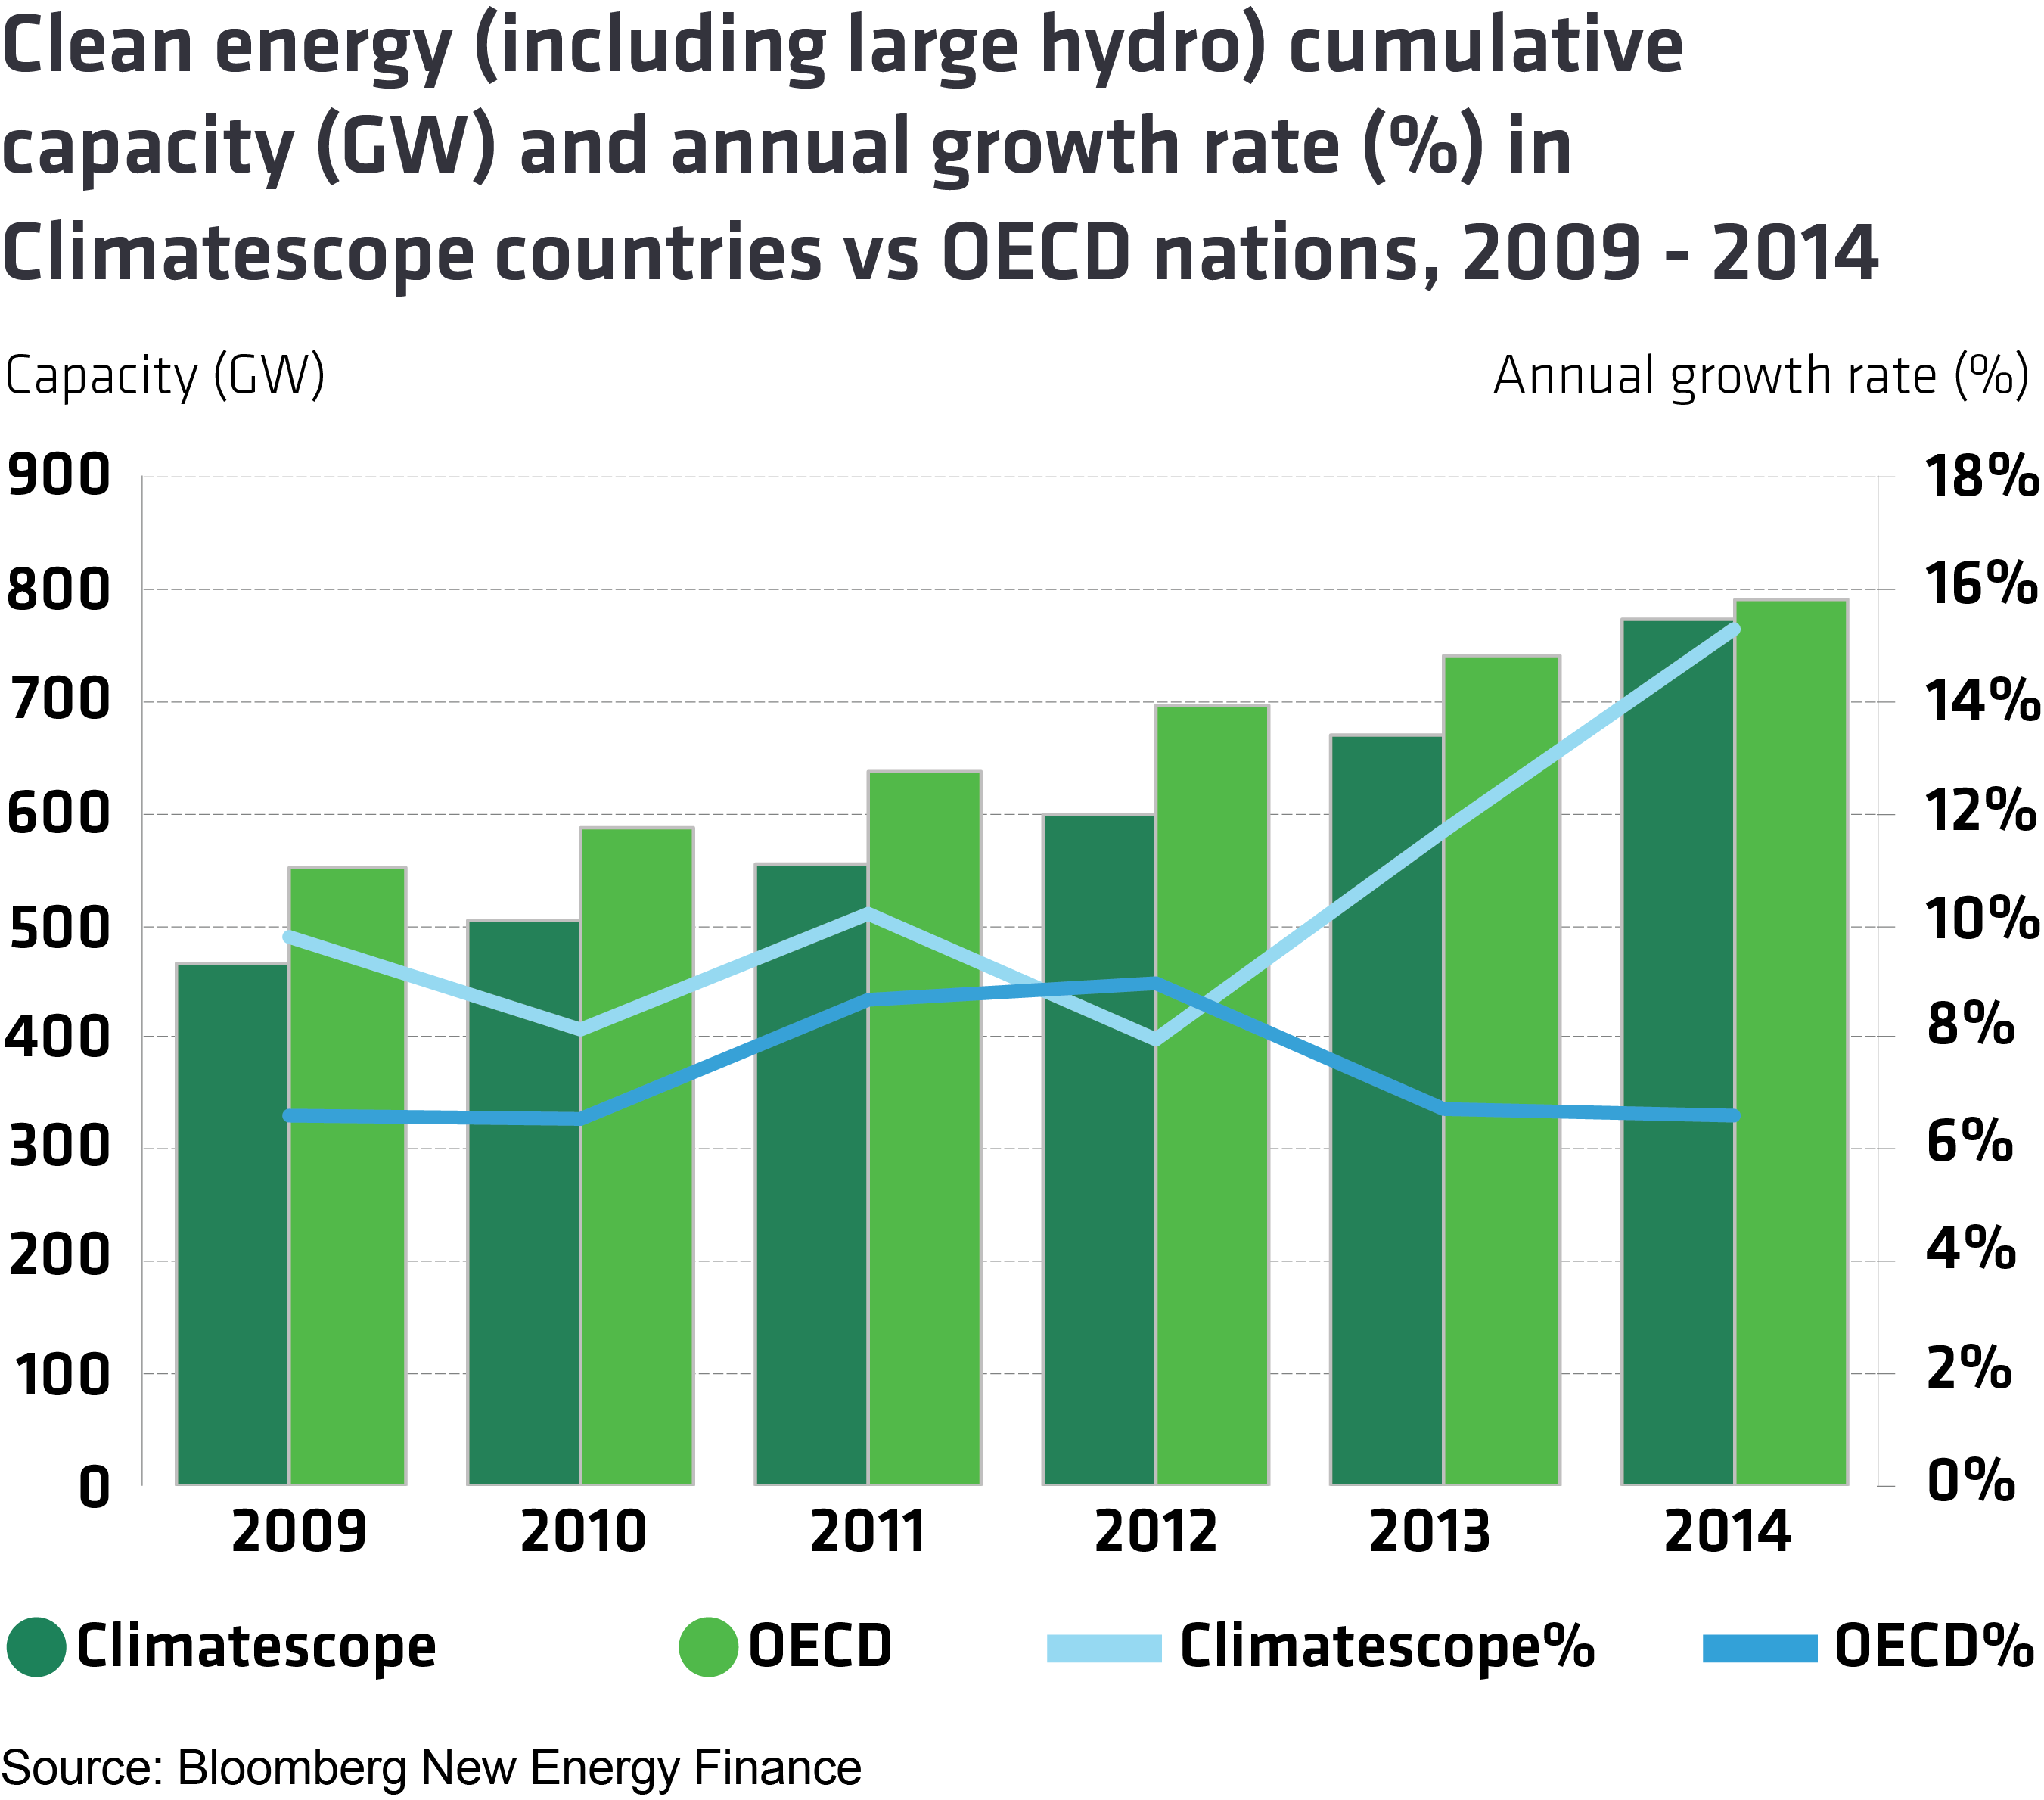
When large hydro is included in the overall figures, however, Climatescope nations have nearly as much clean generation capacity on line as OECD countries: 777GW compared to 790GW as of year-end 2014. Again, the rate of growth of low carbon energy (inclusive of large hydro) is twice as fast in Climatescope countries as in the OECD. When other non-OECD countries (not included in Climatescope) are also included, total clean energy capacity including large hydro in these emerging and developing nations exceeds that in OECD countries.
The importance of China
China continues to play a critical role in clean energy’s evolution, not just in emerging markets but in all countries. The nation added 35GW of new renewable power generating capacity all on its own – more than all capacity online today in sub-Saharan Africa’s 49 nations combined, excluding South Africa and Nigeria – and attracted $89bn in all types of new clean energy capital.
Subtracting out China’s impact, however, Climatescope’s other 54 nations achieved important progress in 2014. On a percentage basis, the growth rate for cumulative clean energy installed in these countries spiked to 21.2%, again more than twice the rate of growth seen in OECD countries. In all, the non-China Climatescope nations added 15.5GW of new capacity in 2014 compared to 9.4GW installed the year prior – a 64% jump.
China now appears on track for another very strong year in 2015. Through the first six months of the year, it had deployed an additional 20GW. However, today a considerable amount of clean power produced in China never reaches its destination due to transmission constraints. Through the first half of 2015, 9.5% of all Chinese output from solar projects was “curtailed” due to such bottlenecks. Officials are seeking to address this through new “green dispatch” rules that mandate that clean energy generated gets used by end consumers, but considerable work remains to nationalize this policy.
Cost competitiveness for renewables
An estimated 1.3bn people lack acceptable access to energy worldwide. Among some in the development community, the debate over renewables’ ability to address this challenge continues; critics insist only fossil sources of generation are inexpensive enough to be cost-competitive in such a context.
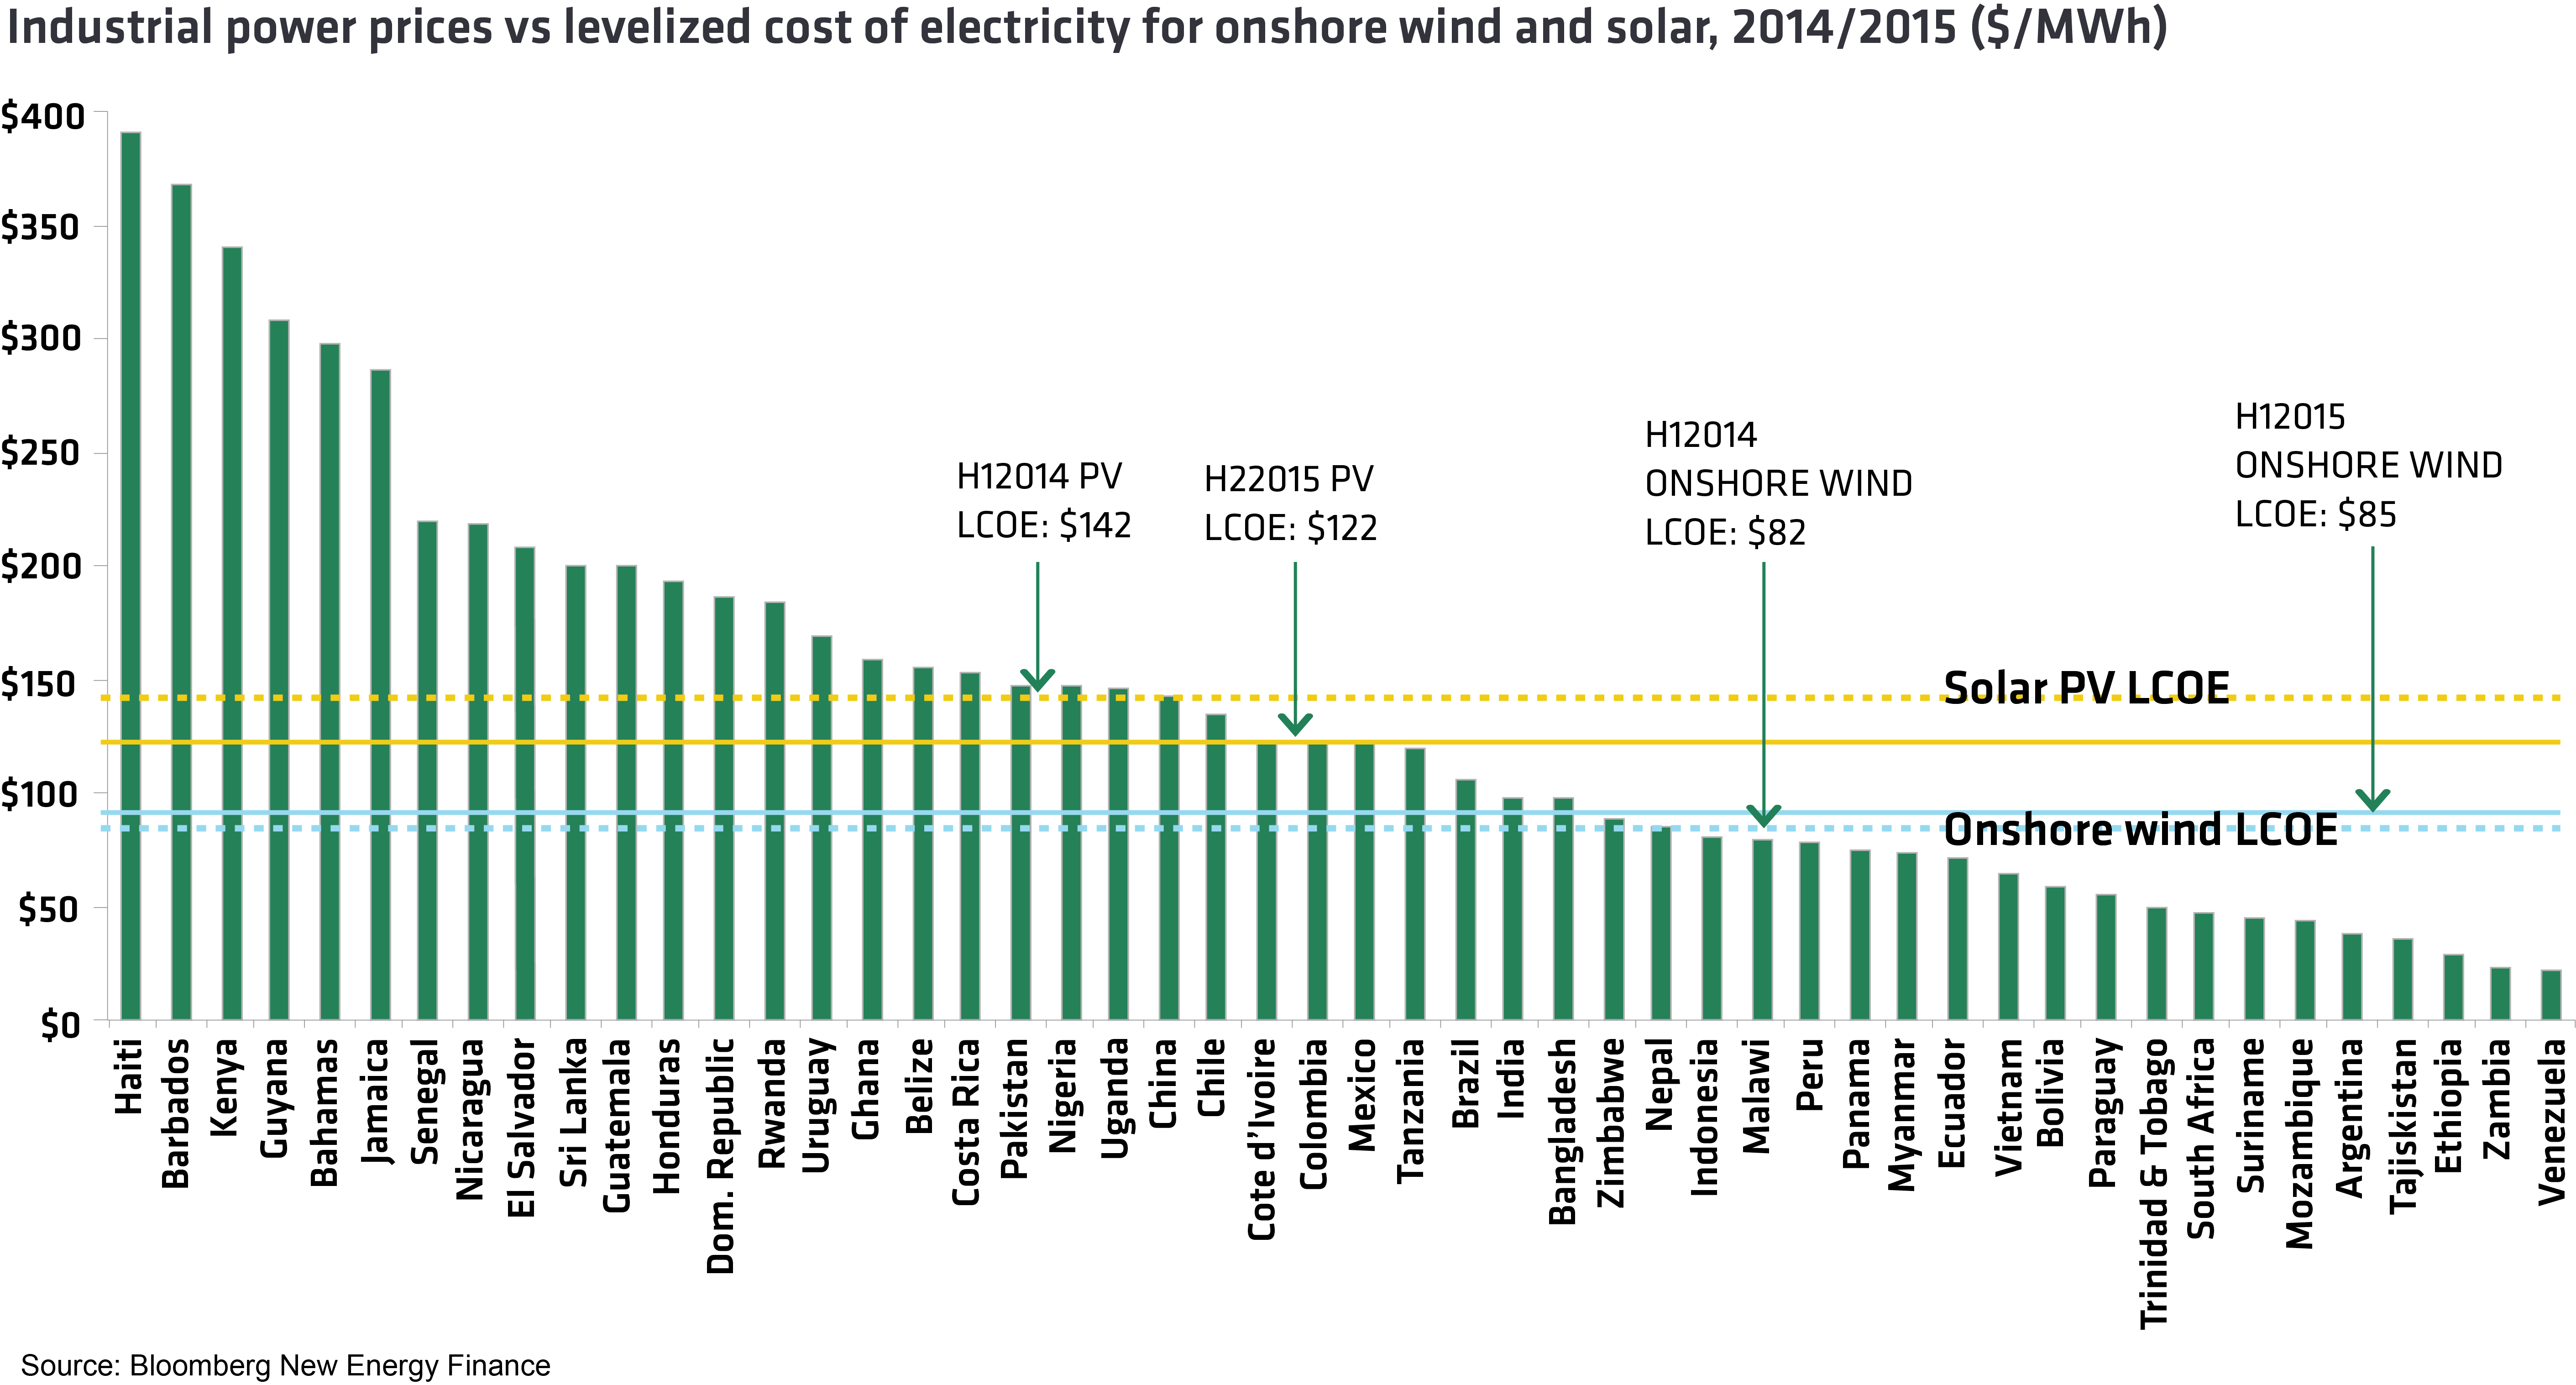
The first global edition of Climatescope, released in 2014, illustrated how exorbitantly high electricity prices for businesses and consumers in these nations make renewable generation there more cost competitive. This year’s study not only confirmed this but suggested renewables are making further progress.
Industrial power prices remained stubbornly high in many of the 55 Climatescope nations in 2014 even as the “levelized cost of electricity” as calculated by Bloomberg New Energy Finance ticked down 15% year-on-year. Wind prices have stayed roughly level, but the technology is already price competitive in many emerging markets.
Looking ahead, there is an open question about whether renewables can continue to achieve such progress on costs. The last quarter of 2014 saw a precipitous drop in crude oil prices. While the impact of that decline on power prices was not evident in the annual average figures collected by Bloomberg New Energy Finance, oil has continued to trade in a lower band in 2015. A number of Climatescope nations, particularly those in the Caribbean and parts of Africa, are disproportionately reliant on diesel and heavy oil power generation. If lower oil prices produce lower electricity prices, renewables could be impacted.
Clean energy growth despite macroeconomic wind shifts
What makes the progress achieved in 2014 all the more notable is that it took place as a number of countries saw economic growth begin to cool. Average gross domestic product growth across Climatescope nations slipped to 5.7% in 2014 from 6.4% in 2013 and the slow-down was most acute in several of the largest nations in the survey. Brazil’s GDP growth slid from 2.8% in 2013 to just 0.1% in 2014. South Africa’s slipped from 2.2% to 1.5%. Meanwhile, China’s fell from 7.4% to 7.1%, according to its official government statistics.
What might explain this contrast between exceptional clean energy growth and somewhat less exceptional macroeconomic growth? First, there is potential issue of timing. In a number of countries, the economic deceleration began toward the second half of 2014. Thus any potential negative impact on clean energy build may have been muted. Instead, the downturn may be felt later. A second, somewhat more optimistic view is that clean energy development is simply becoming a fundamental part of how these countries develop and add new capacity to meet local power demand.
Since the turn of the year into 2015, the economic outlook for Brazil, China, South Africa, and other key Climatescope markets has become even more negative. Time will tell if these new, more challenging conditions will put a crimp on further growth for clean energy – or if renewables remain resilient in the face of these new headwinds.
The Climatescope scores
As in the first global Climatescope released a year ago, this year’s country-level results portray nations rapidly advancing along the path toward embracing clean energy development – but with considerable distance yet to travel. The survey scored nations, Chinese provinces and Indian states on a 0-5 basis, taking into account 54 underlying indicators. This year, the average score across all countries came to 1.14. While this certainly represents progress compared to last year’s average score of 1.11, it is again indicative of how much additional work remains to be done. While 27 nations saw their overall scores improve year-on-year, 28 saw theirs decline.
Among the best scorers, there was consistency from last year’s Climatescope with the same nations finishing in the top five, but in a slightly different order. Once again, China scored highest overall with 2.29. Brazil again was second on the list, but did see its score dip slightly. Chile, South Africa, and India rounded out the top five.
On a regional basis, the 10 Asian nations achieved the highest overall average score of 1.40 and were clearly boosted by China’s high score as well as India’s strong performance. The 26 nations in Latin America and the Caribbean achieved an average score of 1.09 while those in Africa scored 1.06. As discussed above, China saw another record-shattering year in terms of both investment and deployment and for the second year received the highest overall Climatescope score, at 2.29. The country was the top scorer on two parameters and finished no lower than eighth on any.
As discussed above, China saw another unprecedented year in terms of both investment and deployment and for the second year received the highest overall Climatescope score, at 2.29. The country was the top scorer on two parameters and finished no lower than eighth on any.
Repeating its performance from last year’s Climatescope, Brazil landed 2nd on the list but saw its overall score slip to 2.12 from 2.17. The country’s lower showing was primarily due a sharp drop in its score on Enabling Framework Parameter I. This was partly due to slowing economic growth in the country. Chile saw its ranking rise one slot year-on-year to third with a score of 1.97, up from 1.79 due to a major jump in its Parameter I score. South Africa sank one slot to fourth but saw its overall score stay approximately level at 1.91. Finally, India rounded out the top five with a score of 1.81.